Mapping Probability Distributions in Free-to-Play Digital Bingo Variations
Jonas Schmitz · Jun 15, 2026

Mapping Probability Distributions in Free-to-Play Digital Bingo Variations
Free-to-play digital bingo variations rely on algorithms that generate uniform random outcomes across numbered balls or cards, yet the mapping of probability distributions reveals how specific patterns and player interactions shift expected frequencies in measurable ways. Observers note that these distributions differ from traditional physical bingo because digital systems can incorporate variable card layouts and real-time adjustments without physical constraints, and data from multiple platforms confirm consistent statistical behaviors when thousands of rounds undergo analysis.
Core Principles Behind Distribution Mapping
Probability distributions in these games center on the likelihood of completing predefined patterns such as lines, full houses, or custom shapes, while researchers calculate these odds using combinatorial mathematics that accounts for the total number of possible draws and the positions on each card. Studies indicate that in a standard 75-ball format adapted for free play, the distribution remains uniform at the ball level, but pattern completion rates follow binomial distributions when multiple players compete simultaneously, and experts apply Monte Carlo simulations to map these outcomes across large sample sizes. What's interesting is how free-to-play models often include bonus rounds that alter base probabilities without changing the underlying random number generator, which creates layered distributions that developers track separately for balance purposes.
Impact of Card Layouts on Outcome Frequencies
Card layouts directly influence how probabilities cluster around certain numbers or regions, and analyses show that grids with clustered high-frequency numbers produce completion rates that deviate slightly from theoretical expectations during extended play sessions. Those who've examined server logs from various platforms report that free-to-play variations frequently randomize card assignments at the start of each round to maintain fairness, which in turn smooths out distribution spikes that might otherwise favor particular patterns, and this randomization integrates with player count data to adjust expected values dynamically as participation fluctuates.
Variations Across Digital Game Modes
Different modes introduce unique distribution profiles, whereas 90-ball games tend toward slower pattern completions due to larger grids and more numbers in play, and 75-ball versions accelerate distributions because fewer draws are required on average to hit winning combinations. Data shows that speed bingo variants compress these timelines further by limiting the total balls called, which concentrates probability mass on early-round outcomes, and platform metrics collected in June 2026 highlighted measurable shifts in completion histograms when operators introduced hybrid modes combining elements from multiple formats. Developers use heat maps and cumulative distribution functions to visualize these differences, allowing precise calibration so that free-to-play rewards align with intended engagement curves without introducing bias into the core randomness.
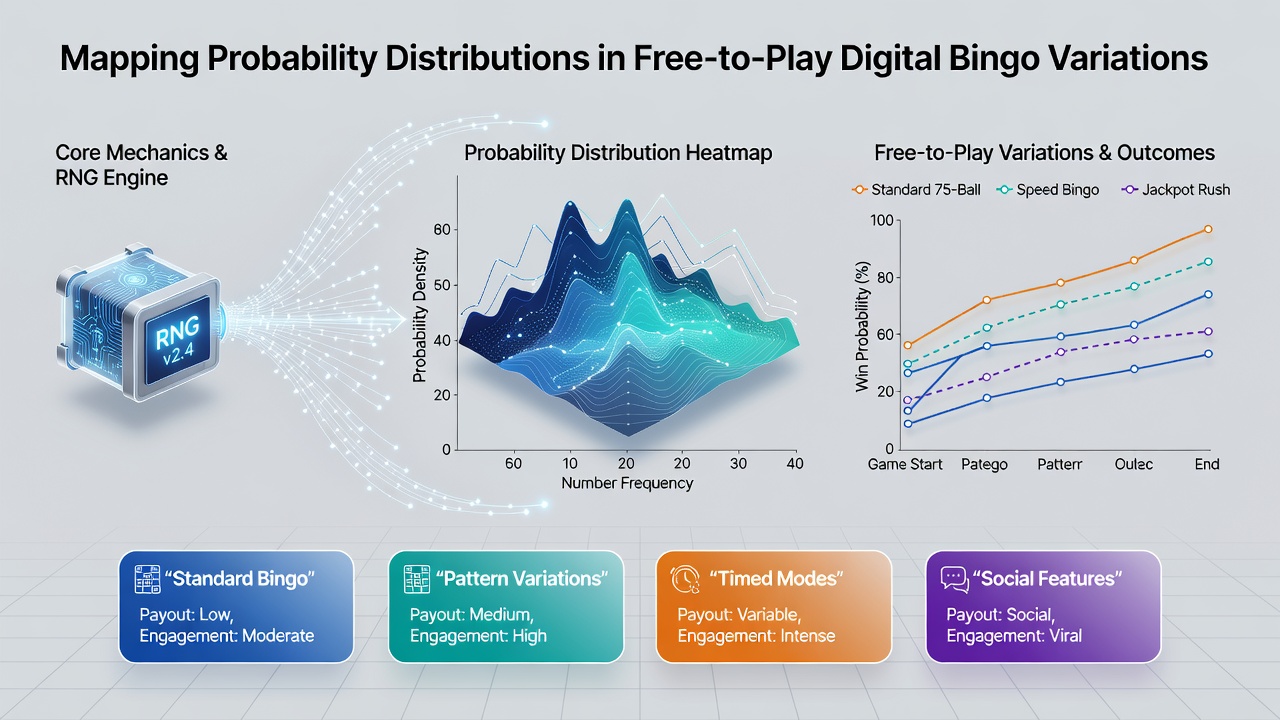
Multiplayer environments add another dimension because shared draws mean individual probabilities become interdependent, and statistical models adjust for this by incorporating covariance terms that reflect how one player's progress affects the collective pool. Research from academic gaming labs demonstrates that these interdependencies produce leptokurtic distributions in high-participation rooms, where extreme outcomes occur more frequently than in isolated single-player simulations, and operators monitor these patterns through live dashboards to ensure equitable distribution across all participants.
Analytical Tools and Data Sources
Mapping relies on a combination of theoretical calculations and empirical validation, while tools such as chi-square tests verify uniformity at the generator level and kernel density estimation reveals subtle pattern biases introduced by card design choices. Reports from the Australian Gambling Research Centre outline methodologies for tracking distribution stability in digital formats, and similar frameworks appear in studies from Canadian research institutions that focus on free-to-play mechanics. Those examining large datasets find that sample sizes exceeding 100,000 rounds provide reliable confidence intervals for probability estimates, which helps distinguish random variation from systematic design effects.
Practical Applications in Platform Development
Platform teams apply these mappings during testing phases to predict average session lengths and reward frequencies, and integration with player behavior data allows refinement of difficulty curves that keep distributions aligned with retention goals. One documented case involved adjusting pattern weightings after initial distributions revealed overrepresentation of certain corner completions, and subsequent iterations balanced the curves through targeted number sequencing without compromising the random draw integrity. External audits from independent testing agencies confirm that such adjustments remain within regulatory tolerances established for chance-based games across multiple jurisdictions.
Conclusion
Mapping probability distributions in free-to-play digital bingo variations provides a structured way to understand and maintain fairness across diverse game formats, and continued analysis supports ongoing refinements as player volumes and mode options evolve. Comprehensive tracking ensures that underlying randomness translates into predictable yet engaging outcomes, which sustains the statistical integrity of these digital adaptations over time.